As a dairy producer, you should evaluate and analyze your farm from many viewpoints on a regular basis. Farms that perform well in one area likely also have an area of weakness that may be holding them back from their maximum profit potential. By evaluating your farm from several different perspectives, you can ensure that your business is well-structured and managed for optimal performance and profit potential in the future. The areas outlined below are important to consider while evaluating the current status of your farm financials and should help highlight a few metrics to benchmark moving forward.
Calculating feed efficiency
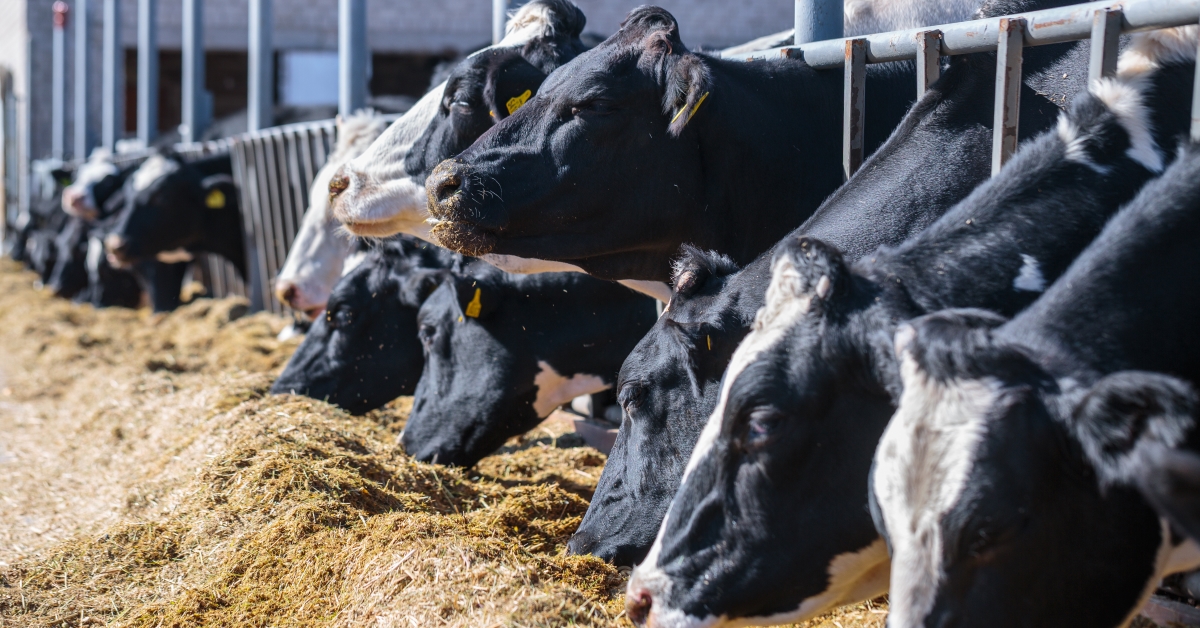
Feed efficiency (FE) is a simple measure that determines cows’ relative ability to turn feed nutrients into milk or milk components. In the simplest terms, it is the pounds of milk produced per pound of dry matter consumed. This measure should be evaluated regularly and will become increasingly important during periods of decreased profit margins. There are two ways to improve feed efficiency: one is to increase milk yield with the same dry matter intake by improving the ration formulation or improving the forage quality, and the other is to decrease dry matter intake and maintain the same milk yield. Many ration modifications that increase milk yield typically also increase feed efficiency.
Energy-corrected milk (ECM) determines the amount of energy in the milk based upon the milk, fat and protein included and is adjusted to 3.5% fat and 3.2% protein. Using the following equation can help you determine the baseline of your herd’s current performance.
ECM = (0.327 x milk pounds) + (12.95 x fat pounds) + (7.2 x protein pounds)
For example, let’s say a herd is currently milking 85 pounds, with 4% fat and 3.3% protein.
Example: (0.327 x 85 lbs. of milk) + (12.95 x 3.4 lbs. of fat) + (7.2 x 2.805 lbs. of protein) = 92 lbs. of ECM
To further identify your FE using your ECM value, you can divide your ECM by the pounds of dry matter intake on a per-cow basis in order to benchmark your current energy-corrected milk feed efficiency.
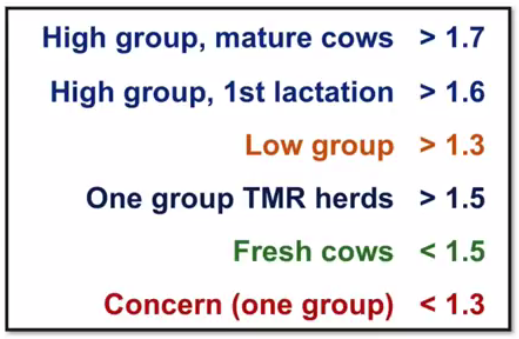
e.g.: 92 lbs. ECM/53 lbs. dry matter intake = 1.73 efficiency
Table 1. Dairy efficiency benchmarks
Profitability is driven by healthy cows in their milking prime. The typical range of ECM between the top and bottom thirds of herds in the U.S. is around 20 pounds of milk per day, or 76 cents of net farm income/cwt. This 76-cent difference between the top and bottom is primarily due to the effect of marginal milk (i.e., those extra pounds that the higher-production cows give), as the last pound of milk is always the most profitable. High-ECM herds also tend to have improved 21-day pregnancy rates, lower feed costs/cwt. of milk, fewer days open, fewer death losses and reduced somatic cell counts.
Calculating component efficiency
Component efficiency is a metric measuring the performance of the cow on a specific diet in the herd environment. It is a simple calculation utilizing pounds of fat and pounds of protein to determine the pounds of components devised by average dry matter intake. The following example highlights the component efficiency of a herd milking 85 pounds with 4.0% fat and 3.3% protein:
6.21 lbs. of components/53 lbs. of dry matter intake x 100 = 11.71% component efficiency
Table 2. Component efficiency benchmarks
|
Excellent |
Greater than 12% |
|
Good |
Greater than 11% |
|
Fair |
Greater than 10% |
|
Marginal |
Greater than 9% |
Most dairies are limited by the number of cows they can house and feed. Therefore, the profitability of the herd is often dependent on how efficient the herd is at producing milk and milk components, especially in times of high component pricing.
Calculating income over feed cost
Income over feed cost is defined as the amount of income from milk sold that remains after paying for the purchased and farm-raised feed used to produce that milk. These values can vary greatly between herds, depending significantly on which feeds are raised on the farm versus those that are purchased and brought to the farm. For this calculation, three parameters must be known: milk yield (lbs./cow/day), milk price ($/cwt) and feed costs ($/cow/day).
Example: 85 lbs./cow/day milk yield, $18/cwt milk price, $6.50/cow/day feed costs.
Income: $15.30 cow/day – $6.50 feed costs = Income over feed costs of $8.80
Calculating feed cost per 100 lbs. of milk sold
When calculating feed costs, some people include only the lactating cows, while others include lactating and dry cows, and still others include all animals on the farm. Deciding which animals are accounted for while calculating feed costs makes a lot of difference when determining the potential milk margin.
In our example herd, we are milking 100 lactating cows producing an average of 85 pounds (92 lbs. ECM) and eating 53 pounds of dry matter priced at an average of $0.122 per pound. The herd feeds 20 dry cows eating an average of 28 pounds of dry matter per day, priced at $0.10 per pound. The herd raises 50 young heifers (<12 months) that eat an average of 14 pounds of dry matter per day, priced at $0.09 per pound, and 50 yearlings eating an average of 25 pounds of dry matter per day, priced at $0.08 per pound.
The cost of feeding the 100 lactating cows is calculated as: 100 x 53 x $0.122 = $646.60/day, for an average of $6.46 per lactating cow per day. The cost of feeding the 20 dry cows is: 20 x 25 x$0.10 = $50/day, or $2.50 per dry cow per day. For the young heifers, the daily feed costs are 50 x 14 x $0.09 = $63/day, or $1.26 per young heifer per day. The daily cost to feed the older heifers is: 50 x 22 $0.08 = $88/day, or $1.76 per yearling per day.
The herd produces 100 cows x 92 lbs. of ECM = 9,200 lbs. of energy corrected milk per day (or 92 cwt./day).
If one only accounts for the lactating cows, feed costs are $646.60/92 = $7.02/cwt.
If one accounts also for the dry cows, feed costs are now ($646.60 + $50)/92 = $7.57/cwt.
If on also accounts for the replacement heifers, then the feed costs become ($646.60 + $50 + $63 + $88)/92 = $9.21/cwt.
Therefore, $18/cwt. milk – $9.21/total feed cost per cwt. of milk = $8.79 gross margin per cwt. of milk.
In summary, when evaluating feed costs for your operation, it is important to account for all of the animals on the farm in order to benchmark your expenses on a routine basis. To manage your feed costs, you first need to measure what is purchased, what is fed and what is eaten. Feed shrink and refusal feed can quickly add up and take away from your projected margins. The first step in improving any part of your business is to set a goal or a target. Setting goals higher than current performance and starting to improve your operation is both realistic and necessary. Please reach out to your local Hubbard Dairy representative to discuss your goals, and in partnership, we can help you create a road map for success.
- Log in to post comments